SAN SFP Power monitoring
Shows graphical visualisation of SAN SFP IN/OUT Power in dBm.These metrics are important in prediction of variour errors on the SAN.
It is supported only Brocade based switches, Cisco MDS does not have it as per Cisco support.
There are 3 levels available:
- Total level (table): UI ➡ SAN ➡ Total ➡ Frame ➡ SFP power
- Switch level (graph): UI ➡ SAN ➡ Fabric ➡ Switch ➡ Frame ➡ SFP power
- Port level (graph): UI ➡ SAN ➡ Fabric ➡ Switch ➡ Port ➡ SFP power
Examples
Total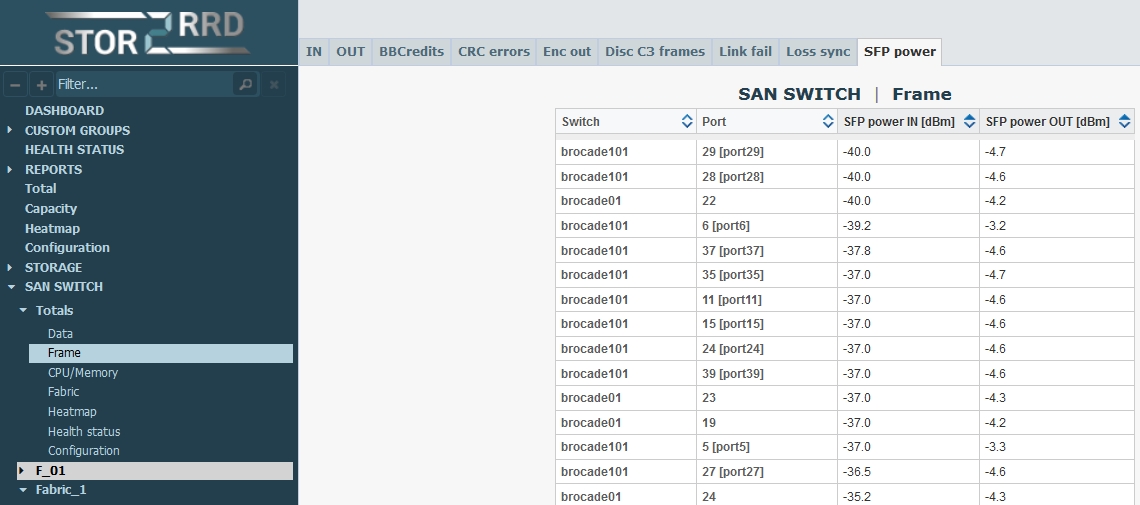 |
Switch 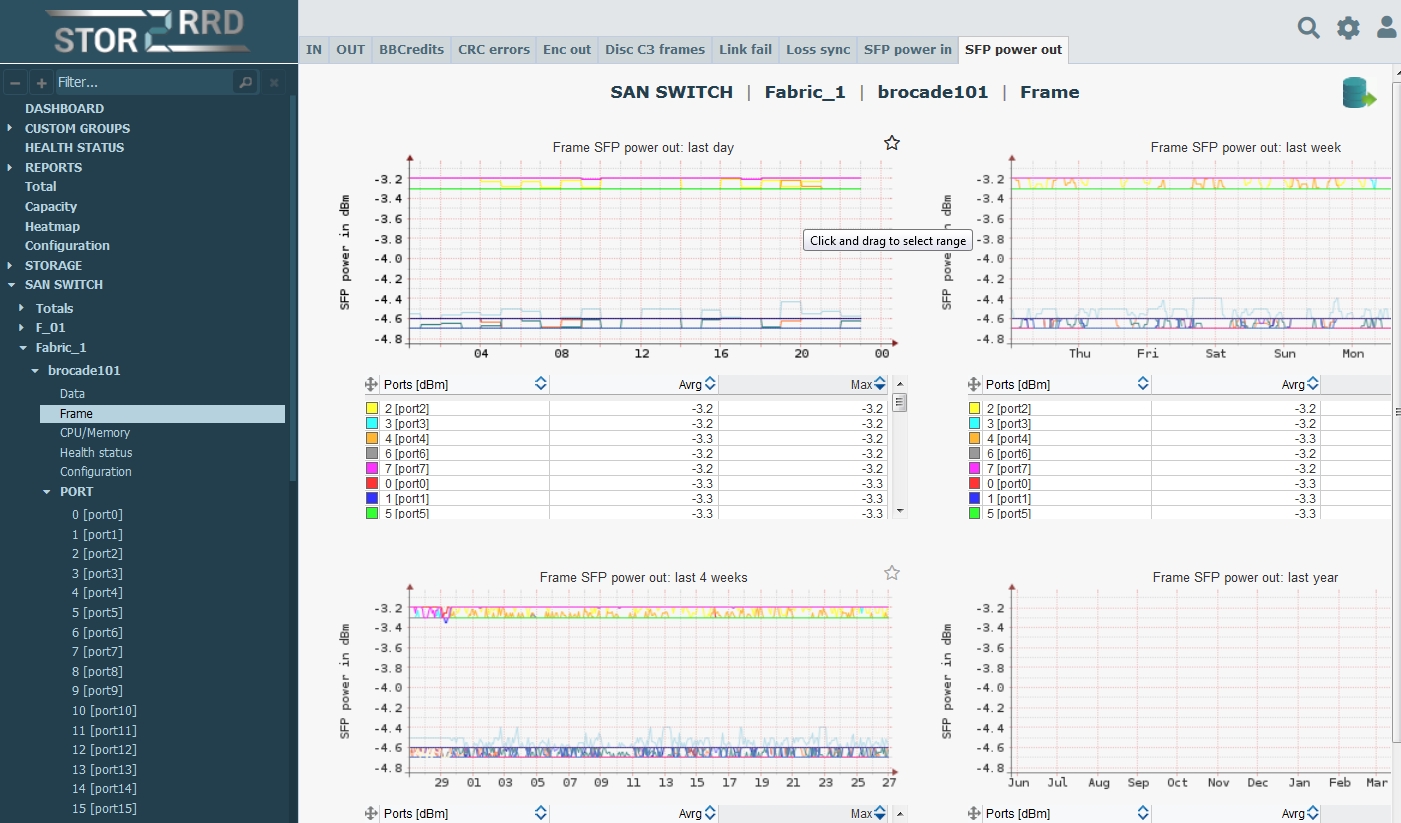 |
Port 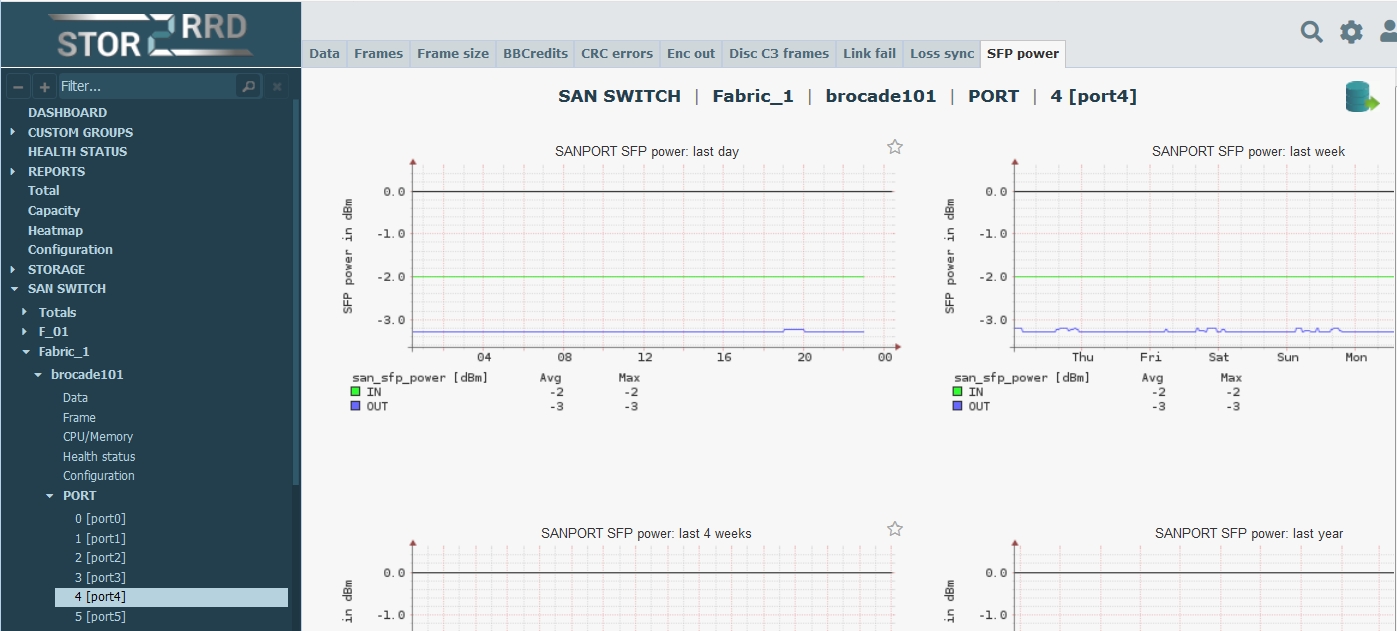 |
SFP Alerting
You can use native Brocade alerting capability for SFP alerting, this is not implemented in STOR2RRDmapsrule --create monitor_ALL_16GSWL_SFPTXP_251 -monitor TXP -group ALL_16GSWL_SFP -value 251 -op LE -action SFP_MARGINAL,RASLOG -policydocs.broadcom.com/doc/FOS-82x-MAPS-UGmapsrule --clone defALL_16GSWL_SFPRXP_0200 -monitor RXP -group ALL_SFP -timebase none -op ge -value 200 -action raslog,email -policy new_conservative_policy
Port 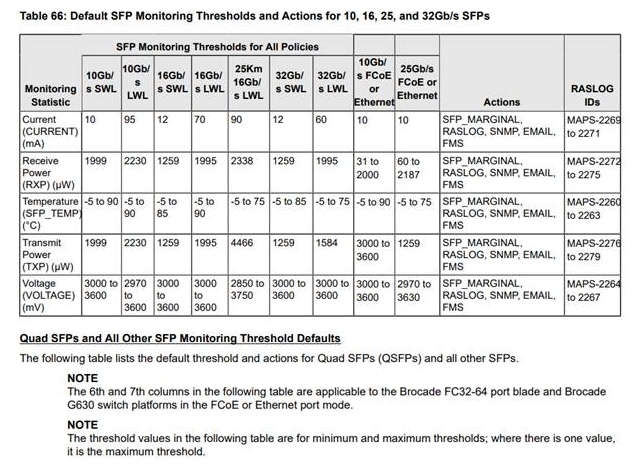 |