SAN monitoring: Brocade, Cisco, SANnav, BNA
It uses either SNMP protocol, SANnav or Brocade Network Advisor as data source (switch REST API comes soon).
You can see all features on our free demo site.
Monitored devices
- Brocade and all its re-brands
- Brocade SANnav
- Brocade Network Advisor
- Cisco MDS
- Cisco Nexus
- QLogic
Feature matrix
| total |
fabric |
switch |
port |
metrics |
|
|---|---|---|---|---|---|
| Port | 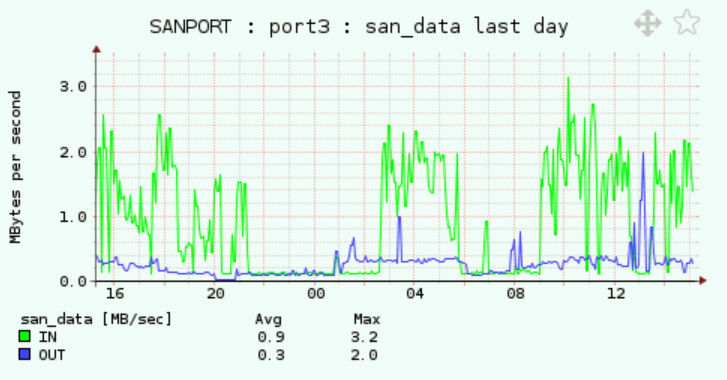 |
Data in/out Frames in/out BB credits CRC errors |
|||
| Port aggregated |
 |
||||
| Switch aggregated |
 |
 |
|||
| ISL aggregated |
 |
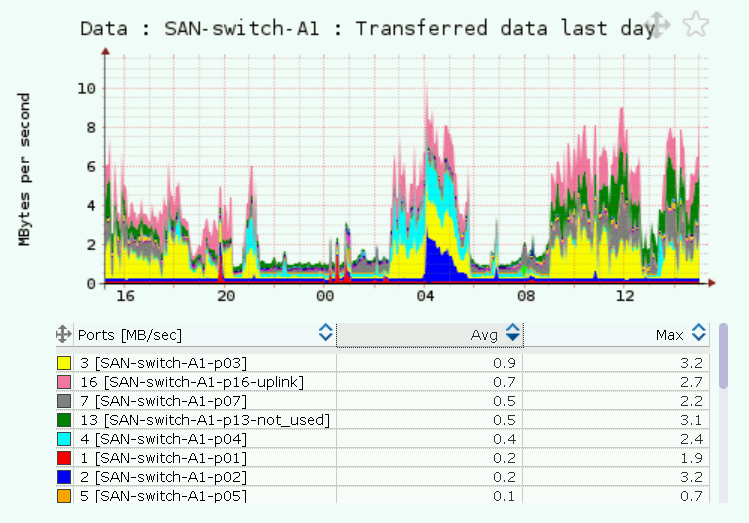
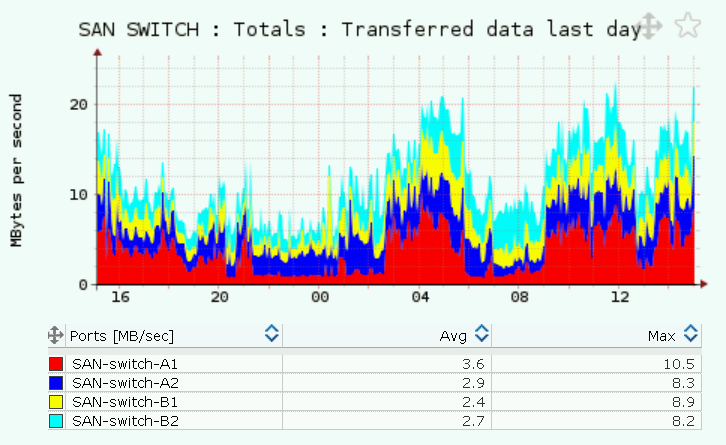
Monitored metrics
- Data throughput [MB/sec]
- Frame throughput [frames/sec]
- Errors: CRC, encoding, enc out, disc c3 frames, link fail, loss sync, PCS [frames/sec]
- CPU, Memory usage
- Buffer credits usage
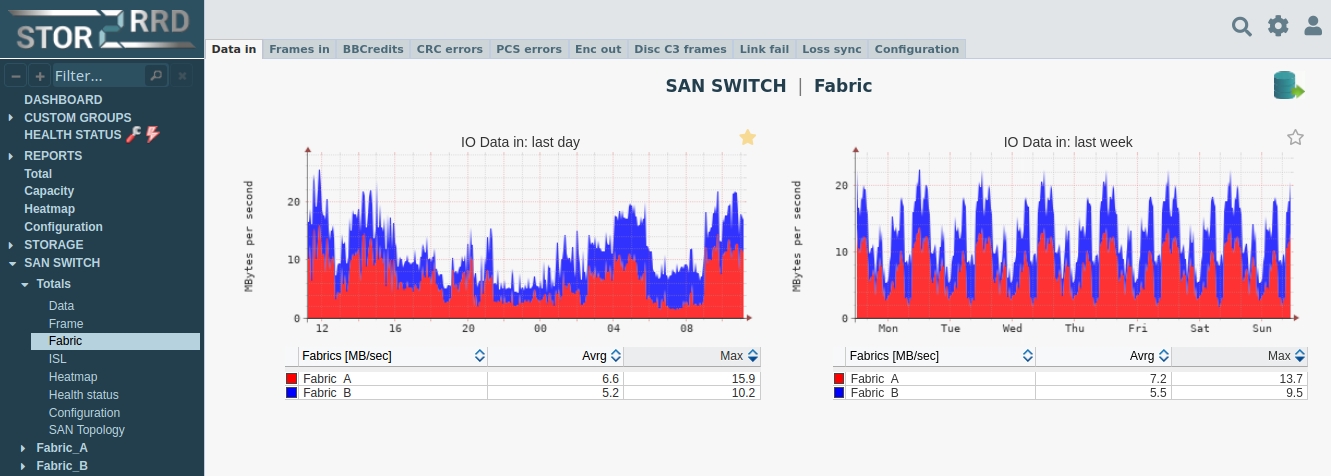
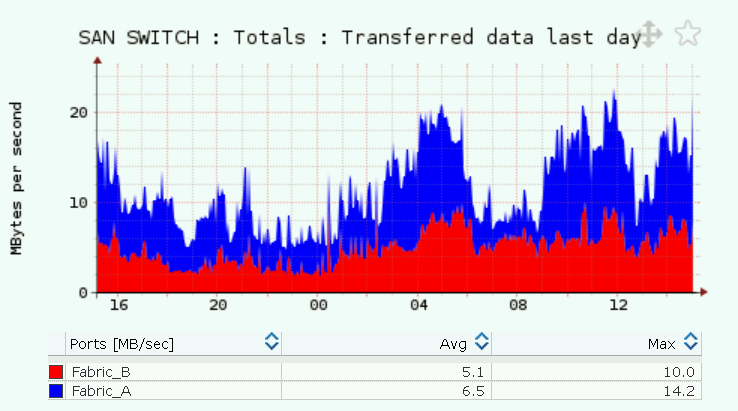
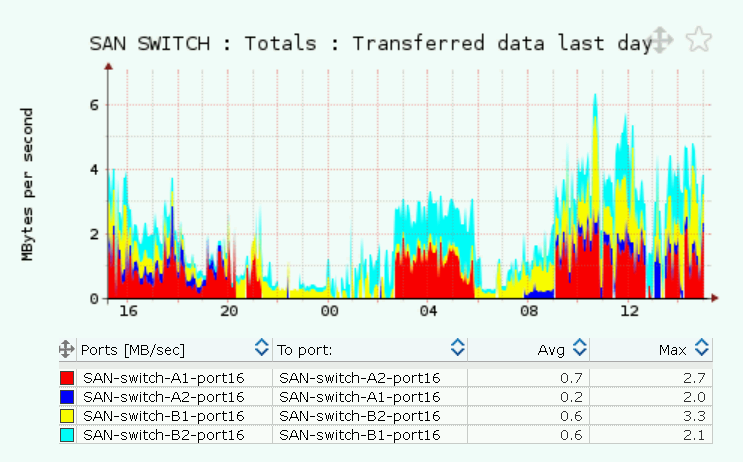
Aggregated graphs per
- Port
- Switch
- Fabric
- All switches total
- ISL (Inter Switch Link)
Additional features
- Brocade vFabric support
- Cisco VSAN support
- Fabric configuration (aliases, zones, ... only for Cisco switches)
- Graphical healthcheck (HW or logical issues on ports or switches)
- Historical reporting
- Alerting: performance metrics
- Alerting: HW issues
- Zone configuration (only via SANnav, BNA)