Dashboard
Dashboard is empty by default.It is up to users to select and place graphs into the dashboard.
Each graph has a star on its top-right, by clicking on it appears a dialog for adding the graph into the dashboard. You can create here new dashboard tabs and groups or add the graph into already existing ones.
Dashboard is fully customizable, you can:
- Create a new tab
- Create a new group
- Move graphs between groups (drag&drop)
- Resize graphs (drag&drop)
- Resize groups (drag&drop)
Check an example on our demo site
|
1. Select a graph and click on a star 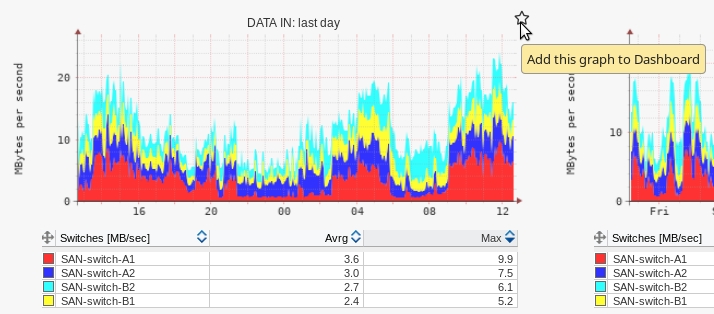
|
➡ |
2. Create new group 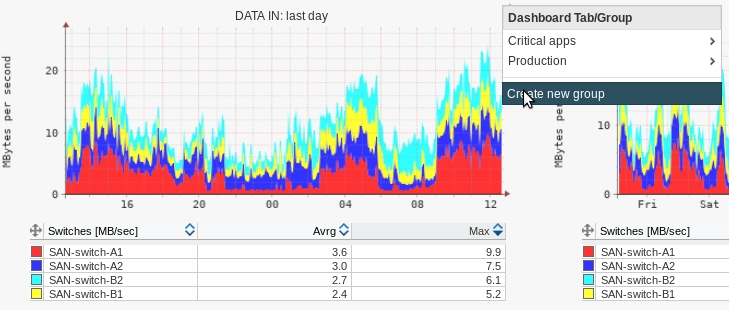
|
➡ |
|
3. Select new names 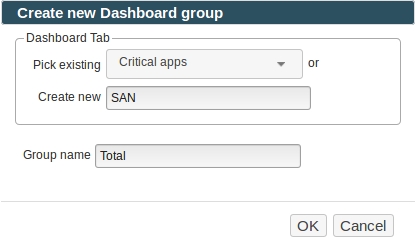
|
➡ |
4. Dashboard result 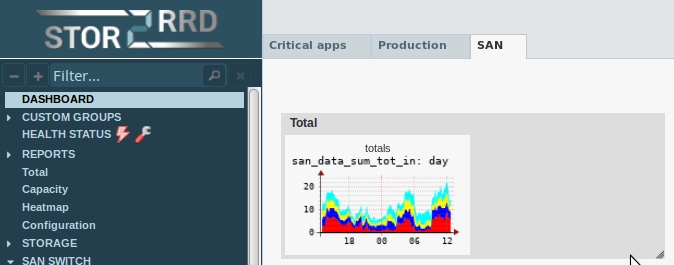
|
|
|
5. Add additional graphs and resize graphs/groups 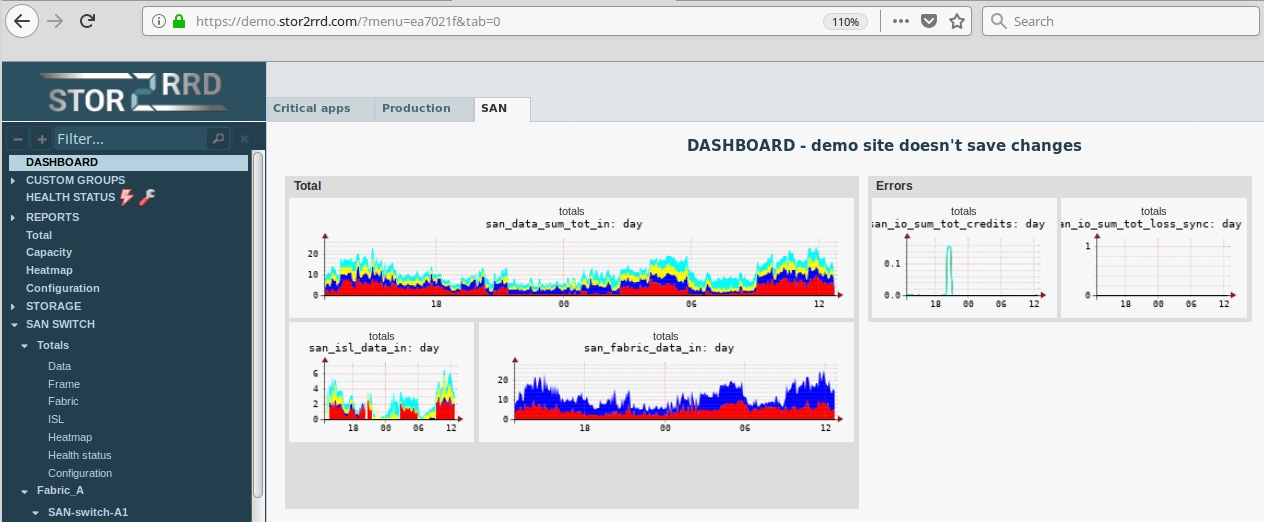
|
|||